# Correlate traces and logs
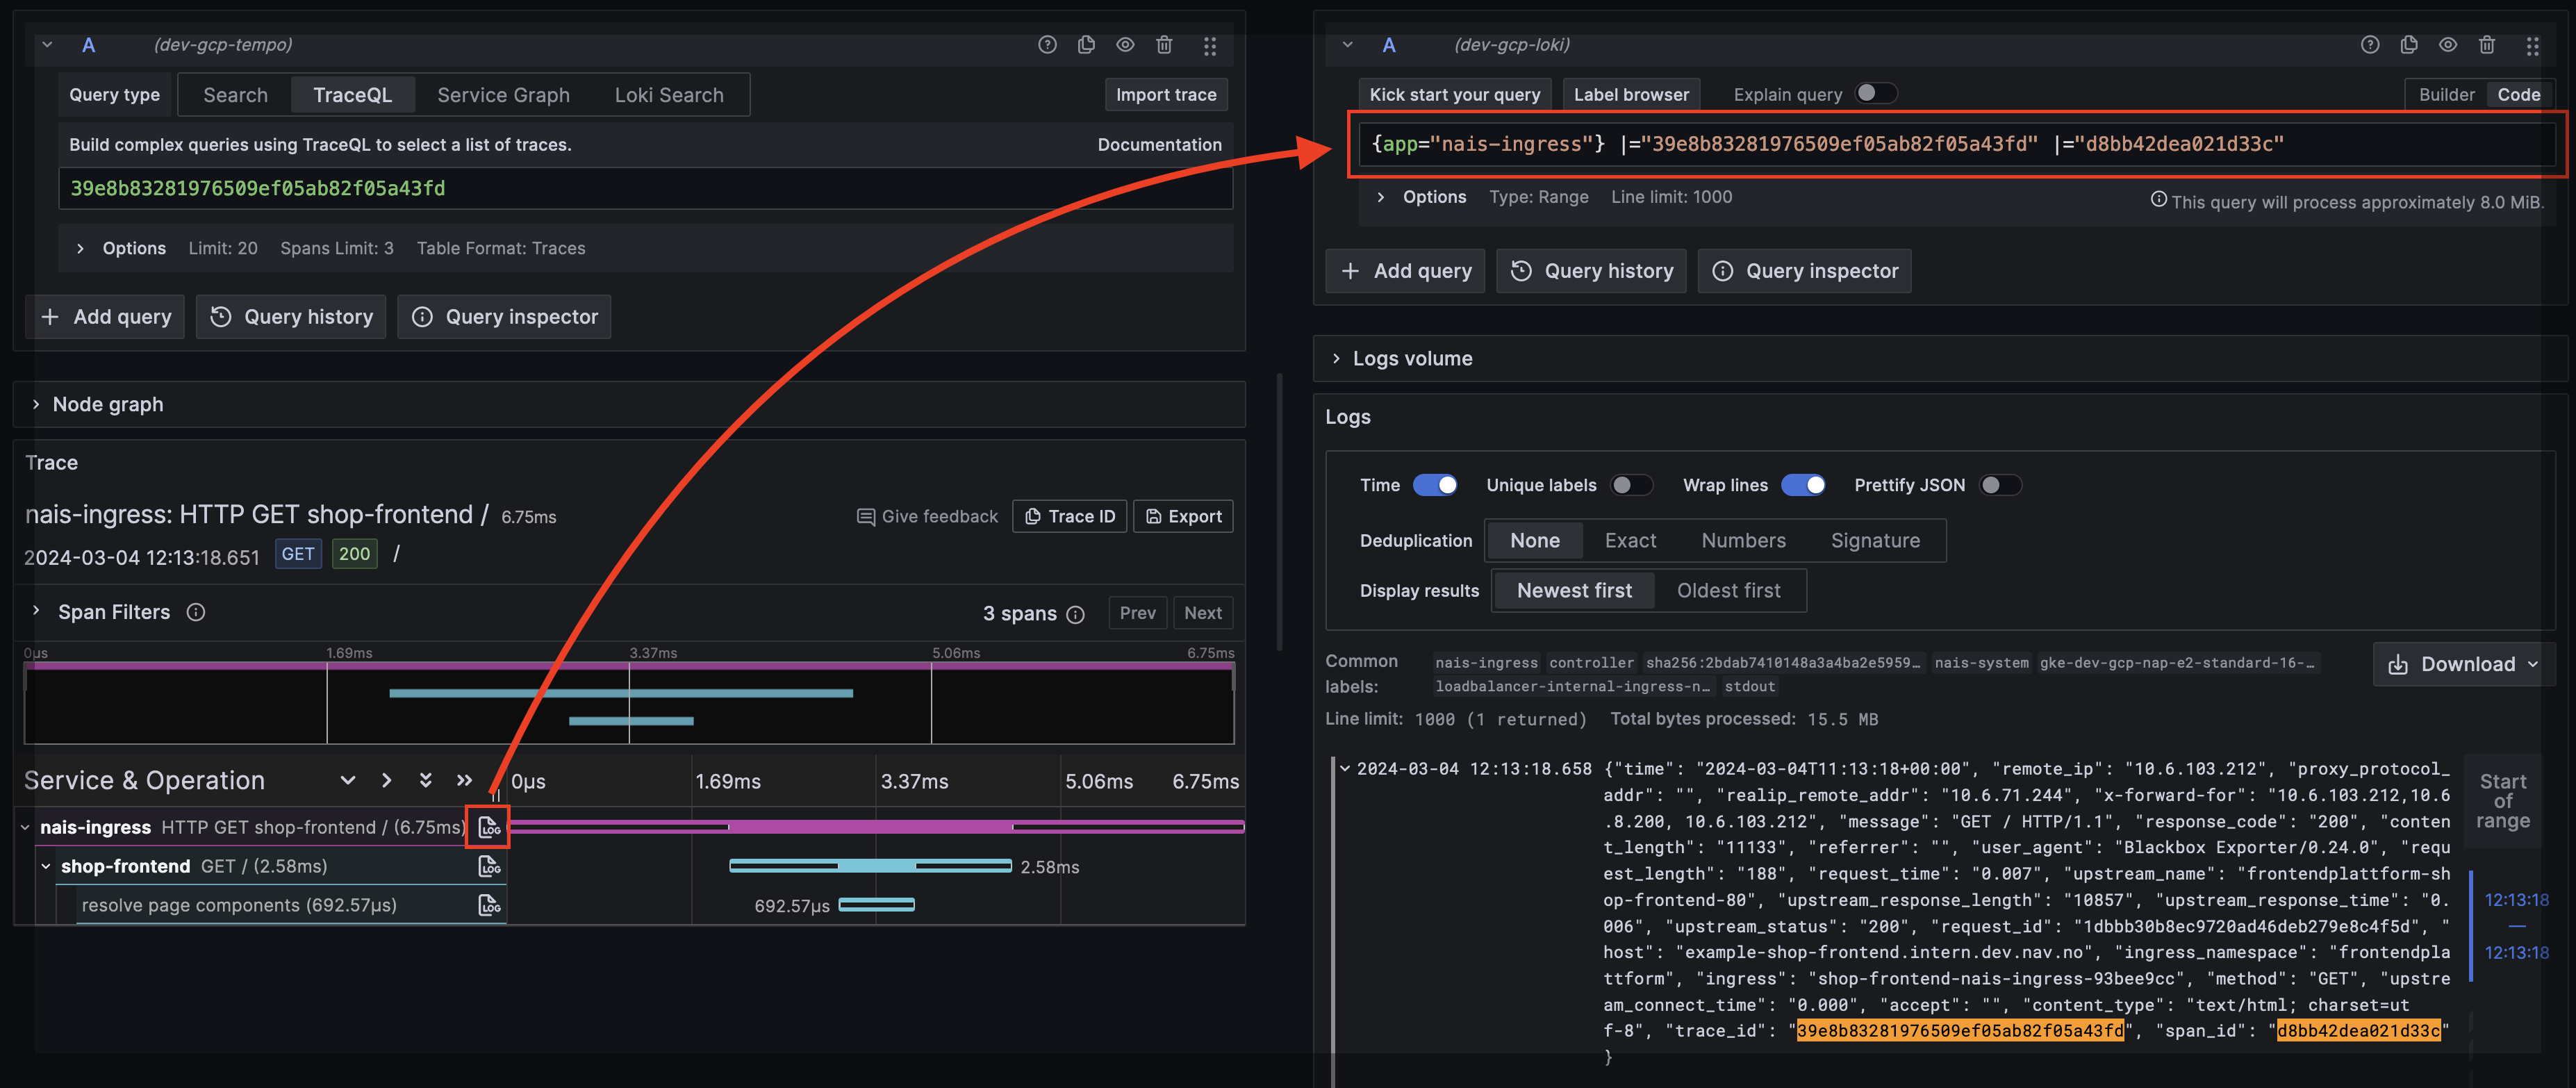
This guide explains how to correlate traces with logs in Grafana Tempo. When set up correctly, clicking a trace shows the associated logs — and clicking a log line links back to its trace.
## Prerequisites
1. [Auto-instrumentation enabled](/observability/how-to/auto-instrumentation.md) (or manual OTel SDK setup)
2. [Logs sent to Grafana Loki](/observability/logging/how-to/loki.md#default-logging-with-grafana-loki)
## How it works
The OTel Java agent automatically injects `trace_id` and `span_id` into your logging framework's MDC (Mapped Diagnostic Context). If your log output includes MDC fields, correlation works out of the box — no extra dependencies needed.
**Most Nav apps already have this working.** If you use `LogstashEncoder` (which outputs all MDC fields as JSON), trace context is already in your logs.
## Verify it works
1. Open [Nais APM](https://grafana.dev-nais.cloud.nais.io/a/nais-apm-app) and find a trace for your service
2. Click "View logs" — if correlated logs appear, you're done
If logs don't appear, check the troubleshooting section below.
## Log format requirements
**logback (LogstashEncoder)**
If you use `LogstashEncoder`, all MDC fields (including `trace_id` and `span_id`) are included automatically:
```xml
```
No extra dependencies or appender wrapping needed when using auto-instrumentation.
**logback (PatternLayout)**
If you use a plain `PatternLayout`, add `%X{trace_id}` and `%X{span_id}` to your pattern:
```xml
%d{HH:mm:ss.SSS} [%t] %-5level %logger{36} traceId=%X{trace_id} spanId=%X{span_id} - %msg%n
```
**log4j2**
Log4j2 context data injection is automatic with the OTel agent. Use `%X{trace_id}` in your pattern:
```xml
```
**@navikt/pino-logger**
Correlation is automatic with Node.js auto-instrumentation. The trace and span IDs are included in logs without extra config.
If you use Next.js, add the packages to `serverExternalPackages` to prevent tree-shaking:
```javascript
// next.config.js
module.exports = {
serverExternalPackages: ['@navikt/pino-logger', 'pino'],
};
```
**@navikt/next-logger**
Correlation is automatic with Node.js auto-instrumentation.
Add to `serverExternalPackages`:
```javascript
// next.config.js
module.exports = {
serverExternalPackages: ['@navikt/next-logger', 'pino'],
};
```
## Without auto-instrumentation
If your app does **not** use Nais auto-instrumentation, you need to inject trace context into MDC manually. Add the OpenTelemetry logback appender:
```
io.opentelemetry.instrumentation:opentelemetry-logback-mdc-1.0:2.16.0-alpha
```
```xml
```
## Troubleshooting
If trace-log correlation isn't working:
1. **Check your logs contain `trace_id`** — query Loki for your app and look for the field
2. **Verify auto-instrumentation is enabled** — check your nais.yaml has `autoInstrumentation.enabled: true`
3. **Check LogstashEncoder** — if you use a custom pattern, make sure `%X{trace_id}` is included
## Result
When correlation works, Grafana Tempo shows associated logs inline with your trace: